
eNetra Transmission Line Monitoring System
Right-of-way management for high-voltage transmission corridors, built on sub-metre satellite imagery. eNetra TMS detects individual tree crowns along the corridor, estimates the height of each one, measures its clearance to the conductor, and ranks every span by how close it is to a fault — so maintenance can be directed to the highest-risk spans rather than to the full corridor length.
Walkthrough
The operations console in use.
Capabilities
What Transmission Line Monitoring does.
Individual crown resolution
The corridor is resolved into individual crowns rather than a vegetation mask. A deep-learning detector tuned for these crowns runs alongside a classical watershed method, and each crown carries its own position, extent and height.
Per crownHeight derived from shadow geometry
Each crown's height comes from the length of the shadow it casts and the sun elevation recorded for the scene. The shadow bearing is not assumed from metadata — a free search picks the bearing that yields the most shadow runs terminating in bright ground, because on real plantation imagery the textbook assumption locks onto planting rows instead.
MeasuredConfidence reported on every measurement
A shadow run that hits a neighbouring crown, or runs to the search limit without finding ground, is rejected and flagged — and is not substituted with an estimated value. Allometry then supplies a fallback height, self-calibrated against the scene's own high-confidence shadow measurements and marked as a fallback wherever it is used.
Confidence flaggedClearance against the real conductor profile
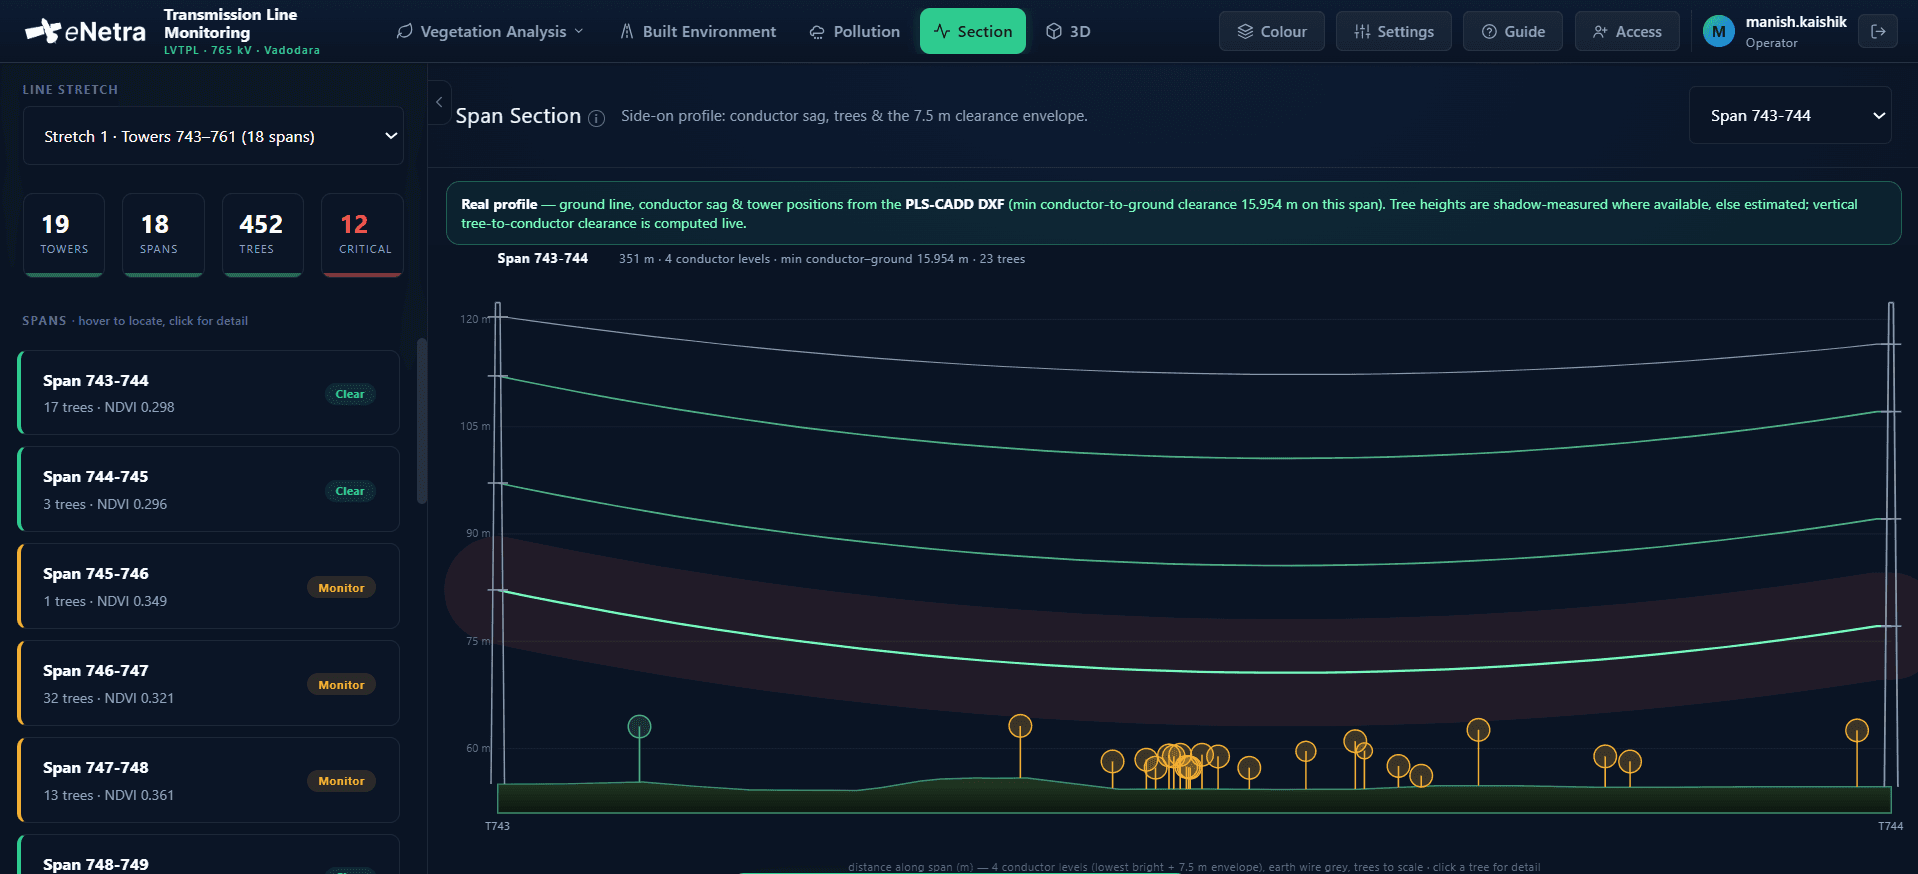
Crown height and position are compared against the conductor levels and tower positions taken from the client's own PLS-CADD plan-profile sheets, not a generic catenary. What comes out is a distance in metres and a margin against statutory clearance, per tree, per span.
PLS-CADDThe corridor in three dimensions
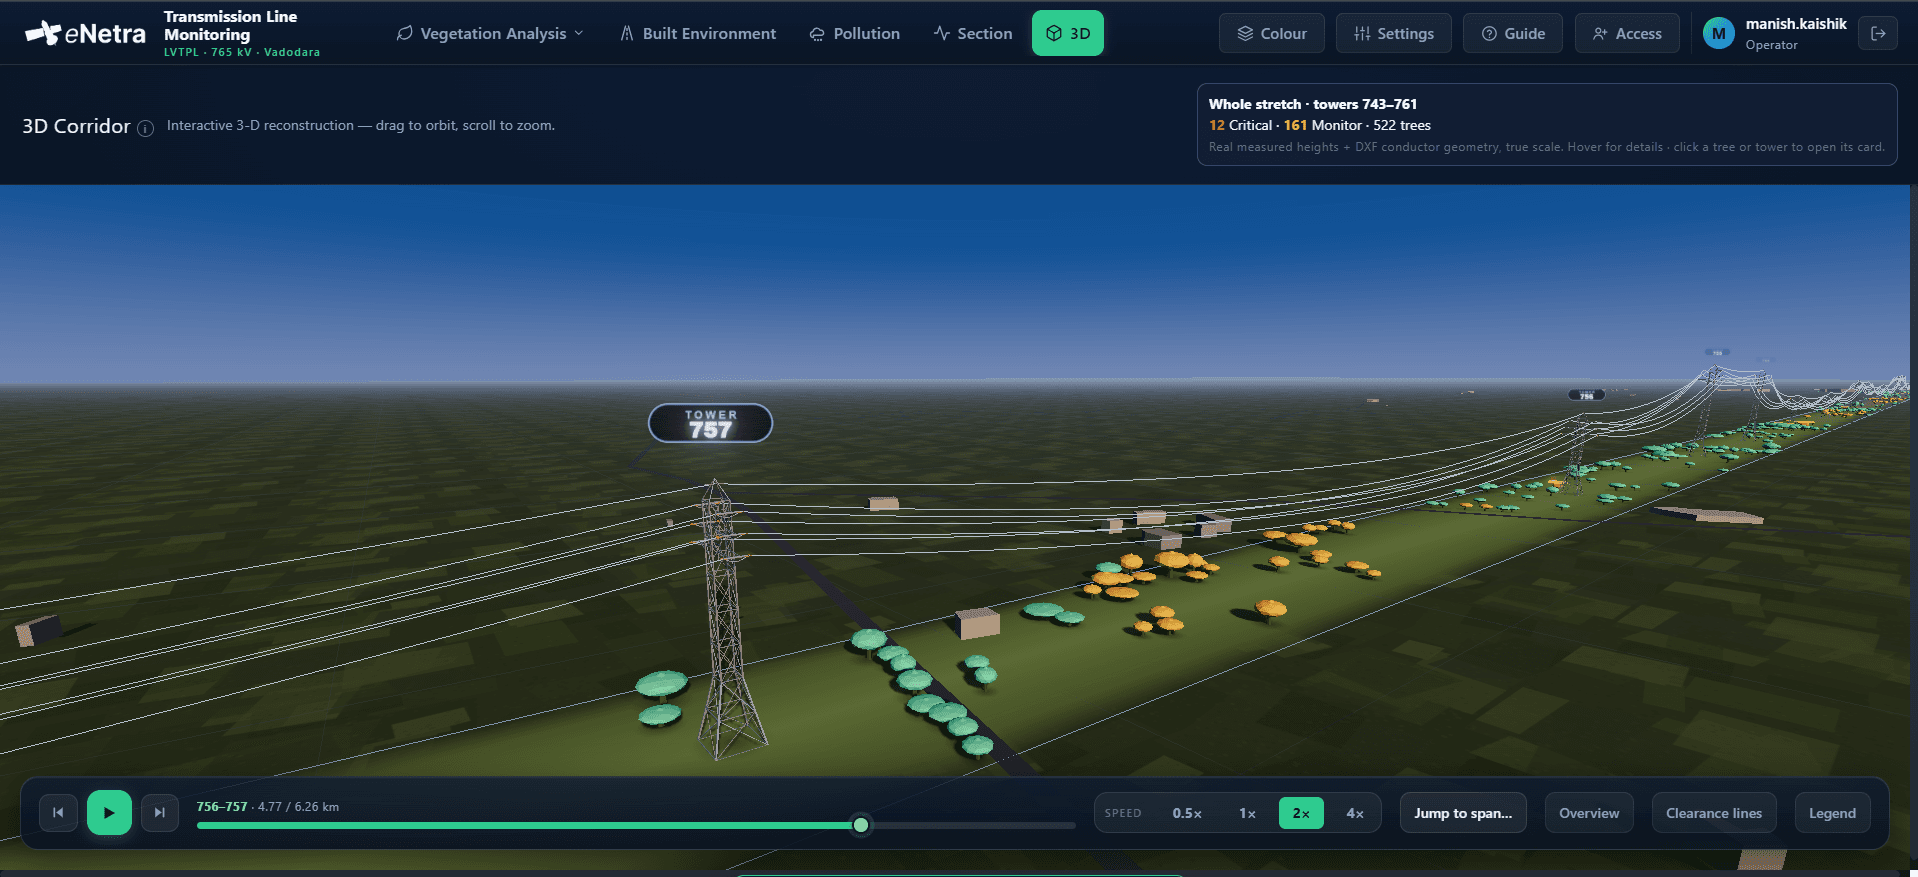
Towers, conductors and detected vegetation are rendered as a navigable 3D corridor, so a section that reads as a number in a table can be inspected as geometry before a crew is dispatched.
3D corridorSub-metre basemap, served live
Cartosat-3 scenes are served as map tiles directly from the source rasters, so analysts work over the real imagery at full resolution instead of a downsampled screenshot.
Sub-metreA single authoritative tree set
Clearance, alerts and the 3D corridor are computed live from the same edited tree set the operator works in. Correct a crown in the tree editor and the alert queue, the section profile and the 3D view all move with it — no view serves a cached result from before the edit.
Live editsPrioritised span ranking
Every span carries a clearance margin and a risk rank, rolled up across the stretch so the queue opens on the worst one. A crew is sent to the twelve spans that matter this month, in the order they should be visited — the output is a work list, not a picture to interpret.
Ranked spansSix vegetation indices
NDVI, NDRE, NDMI, NDWI, SAVI and EVI are computed per span from Sentinel-2, each with its own visualisation range and plain-language reading. Moisture stress and canopy vigour are different questions, and a single greenness index answers neither well on its own.
Six indicesHow it works
From acquisition to closure.
Ingest
Sub-metre multispectral scenes over the corridor are registered and pyramided for fast reads at every zoom.
Detect
Individual tree crowns are extracted along the right-of-way with a tuned detector, cross-checked by a classical method.
Measure
Each crown's height is derived from its shadow using the scene's sun geometry; allometry fills the gaps.
Analyse
Crown geometry is compared to the conductor through the span to produce a clearance margin per tree.
Rank
Spans are ordered by risk and pushed to the alert queue, with the 3D view available for confirmation.
System components
The components of a deployment.
Analytics backend
Precomputed per-span datasets plus a live tile service over the source imagery.
- Crown detection pipeline (deep-learning detector and classical watershed)
- Shadow-geometry height estimation with allometric fallback
- Clearance and risk computation per span
- Tile server reading the Cartosat rasters directly
Operations console
The eight-view corridor dashboard used by the line maintenance team.
- Corridor map with span, tower and vegetation layers
- Span ranking by clearance margin and risk
- Section profile: terrain, conductor sag and crown heights
- Alert queue with history per span
Species and seasonal signature
Species composition determines the rate of regrowth within a span.
- Sentinel-2 species classification per span, with a legend and per-species notes
- Per-tree seasonal signature — the within-year cycle
- Multi-year trend held separately from seasonality, never conflated
- Species mix per span for cutting and replanting decisions
3D corridor and section
Two ways to look at the same span before anyone is dispatched.
- Navigable 3D corridor: towers, conductors and measured canopy
- Plan-profile section with ground, conductor levels and tower positions
- Section geometry taken from the client's PLS-CADD DXF sheets
- Visual confirmation of a flagged span before a crew is sent
Data build pipelines
The offline suite that turns raw scenes into the per-span datasets the console reads.
- Scene registration and overview pyramids built on ingest
- Crown detection, height and clearance rebuilt per span
- Species and seasonal signature datasets regenerated on demand
- Re-runnable end to end, so a corrected input reflows through every view
Built environment and encroachment
Built structures and access roads within the right of way are detected alongside vegetation.
- Road network pulled from OpenStreetMap over the corridor
- Operator alignment tuning that survives a pipeline re-pull
- Hand-marked buildings inside the right of way
- Automated building extraction scored against the operator's own marks
In use
The console, on a live corridor.
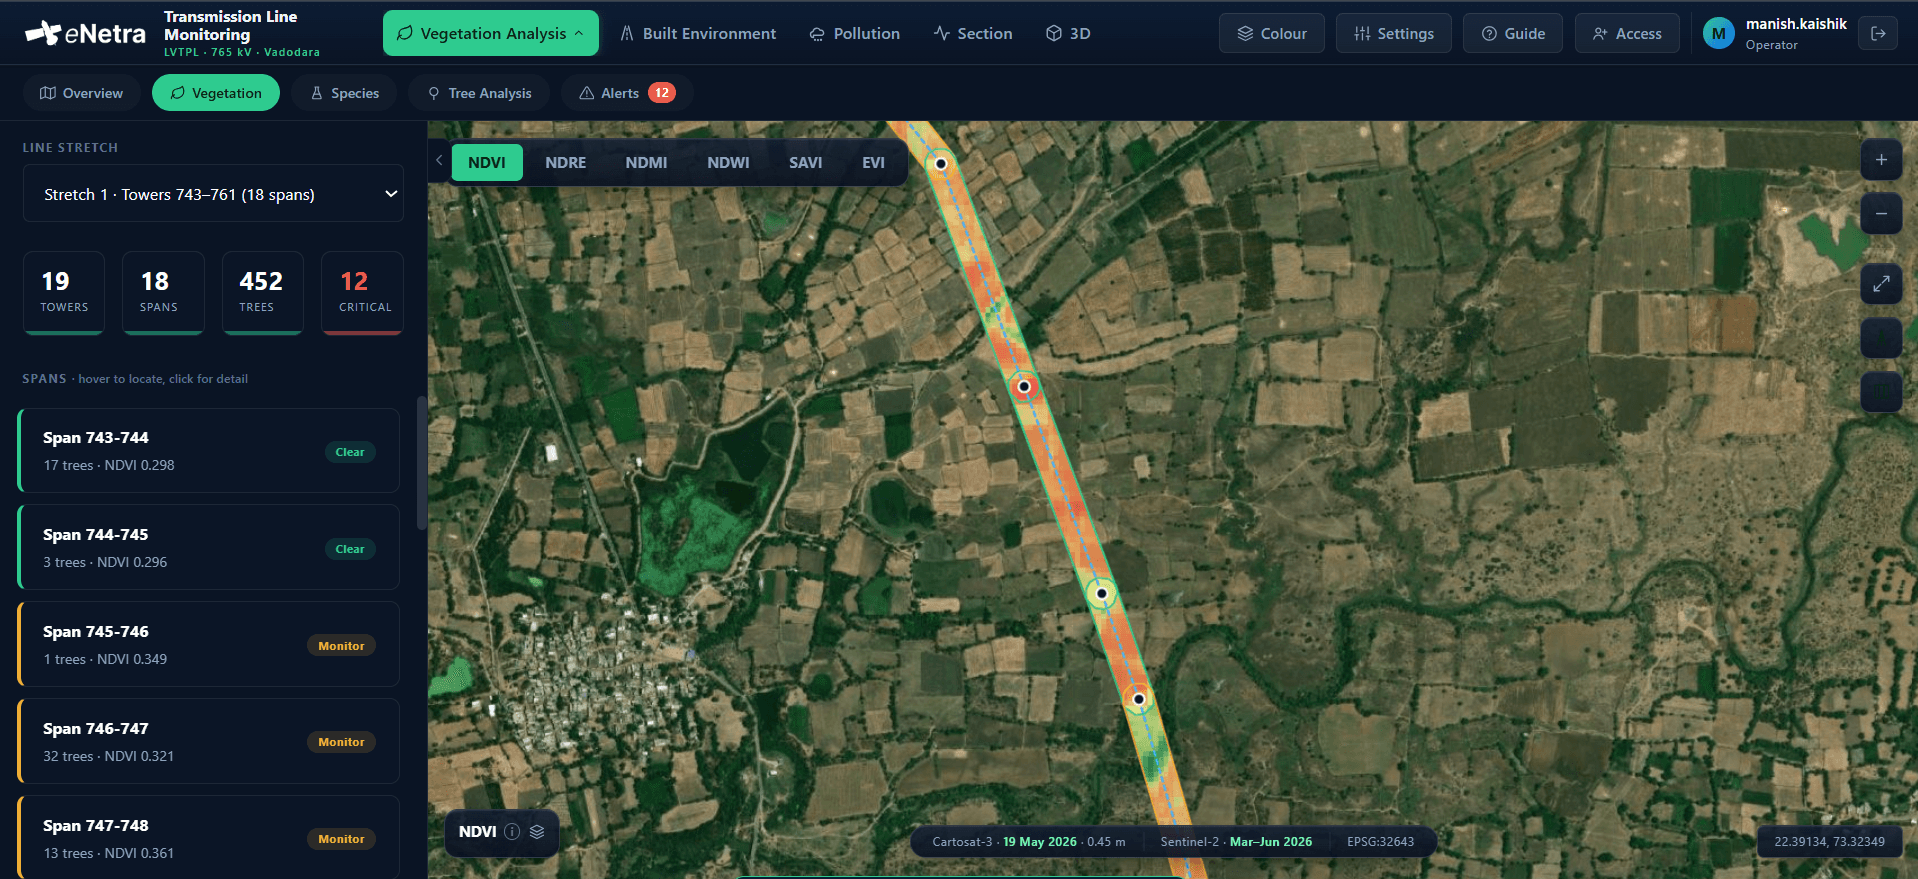
The same stretch in three of the eight views: vegetation condition span by span, the section through a flagged span, and the corridor reconstructed in three dimensions.
What you get
What a deployment delivers.
- Per-span clearance margin and risk rank
- Tree inventory along the right of way — position, crown extent, height and confidence
- Species mix and per-tree seasonal signature
- Plan-profile section for any span
- Encroachment layer: roads and buildings inside the right of way
- Prioritised cutting and patrol schedules
Intended users
| Imagery | Cartosat-3, Cartosat-2, Sentinel-1 & 2, Planet Labs, Maxar, Pléiades |
|---|---|
| Vegetation indices | NDVI, NDRE, NDMI, NDWI, SAVI, EVI |
| Height method | Shadow geometry, with a flagged self-calibrated allometric fallback |
| Conductor geometry | Imported from the client's PLS-CADD plan-profile sheets |
| Views | Overview, Vegetation, Species, Tree Analysis, Alerts, Section, Signature, 3D, Built environment |
| Deployment | Managed cloud or utility infrastructure |
Request a demonstration over your area of interest.
Provide the boundary of your jurisdiction and we will run Transmission Line Monitoring against current imagery of that area.